 Launch Tape
One recorded sell.
Two measures
of impact.
How much did Odyssey’s pool change around its largest recorded sell? We checked 3,001 trade rows and measured both the SOL reserves and the pool’s price.
- Seller received
- 159.6 SOL Largest recorded sell in this sample
- Pool SOL change
- −64.9% 248.0 → 87.1 SOL in adjacent recorded states
- Pool price change
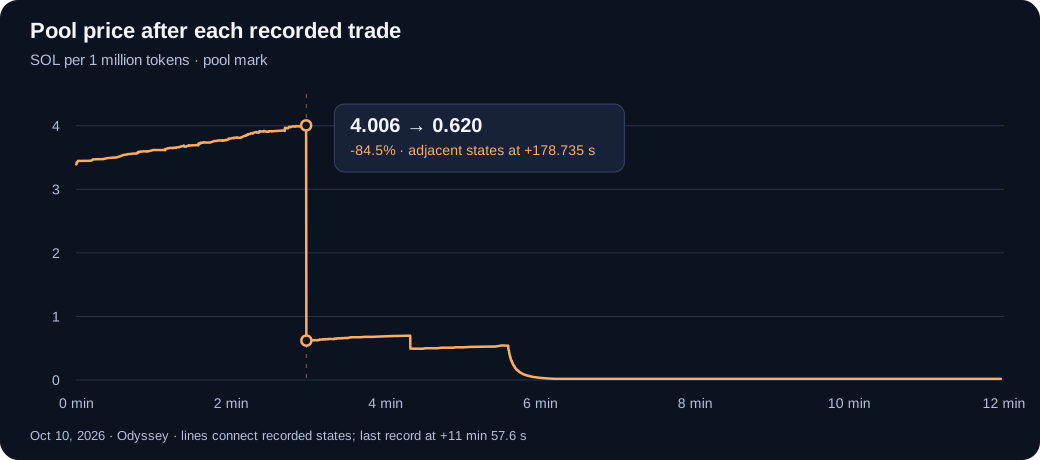
- −84.5% Adjacent recorded marks, not a strategy return
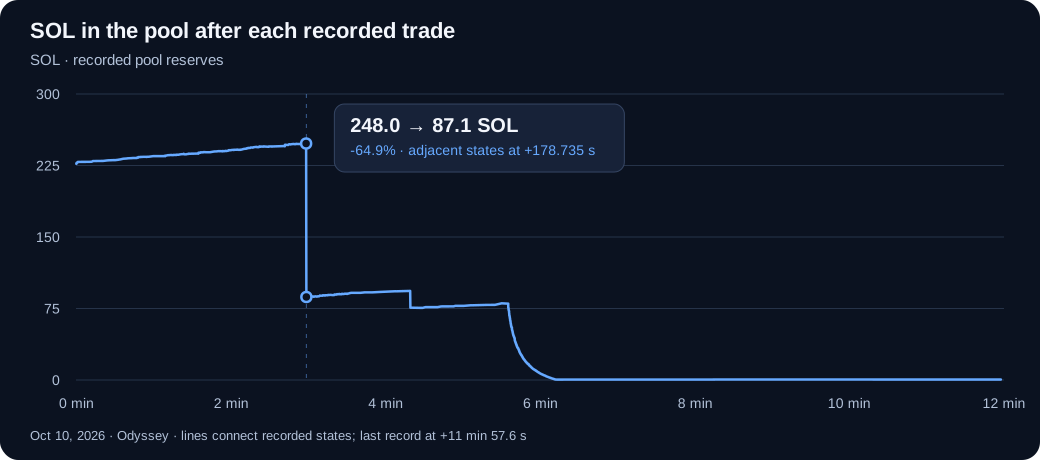
The pool got smaller.
The price moved more.
At +178.735 seconds in the sample, a sell recorded 159.584707613 SOL received by the seller. The adjacent pool states were 248.042363686 SOL before and 87.086791985 SOL after: a fall of 64.9%.
The pool’s price mark fell 84.5% across those same two rows. These percentages answer different questions. The first measures the change in SOL reserves; the second measures the change in the pool’s reported price per token.
The reserve change is 160.955571701 SOL, which differs from the seller’s proceeds. This reduced sample does not include every fee and accounting field needed to reconcile the difference.
Two rows. No hidden model.
| Measure | Previous row | Sell row |
|---|---|---|
| Seconds after graduation | 178.542 | 178.735 |
| Solana slot | 455293232 | 455293233 |
| Pool SOL | 248.042363686 | 87.086791985 |
| Pool price, SOL per token | 0.00000400629 | 0.000000620131 |
Change (%) = (after ÷ before − 1) × 100. Rounded to one decimal in the charts.
What this sample can tell us
We observed 3,001 rows: 682 buys and 2,319 sells. Their recorder timestamps span 14:42:23.320–14:54:20.686 UTC. The first row is at +0.206 seconds and the last at +717.572 seconds.
The source is a 30-minute selection, but it contains no trade row after +11 minutes 57.6 seconds. The charts stop at the last recorded row. We do not infer the later pool state or fill empty minutes with invented trades.
The companion graduates CSV marks this coin as followed for 1,800 seconds with data_gap=0. That metadata reports no flagged gap; the reduced trade sample by itself does not prove complete chain coverage.
This is one selected historical coin. It does not establish a typical outcome, a profitable strategy, wallet ownership, coordination or anyone’s motive.
The data and the method are yours to check.
Download the source trade rows and Python method into the same folder, then run:
python3 research-example-method.py one-coin-odyssey-2026-10-10-1442-1512utc.jsonl --csv minute-summary.csv
The script prints the exact measurements and writes a 30-row minute summary. It makes no network requests. The summary and CSV modes need only Python 3; the optional repository chart build also uses Pillow.
Ordering, source identity and calculation details
- Parse every nonblank JSONL line. Sort by Solana slot, retaining the original row order within each slot. The sample omits transaction signatures and instruction indices, so finer within-slot ordering cannot be independently resolved here.
- Find the sell row with the greatest
solvalue. Compare itspool_solandpricewith the immediately preceding row. The highlighted pair belongs to consecutive slots. - Use source
sfor the horizontal axis. These are recorder-relative seconds, not a promise of transaction execution latency. Lines connect supplied states; there is no extrapolation beyond the last row. - For each minute, count buy and sell rows and report the last supplied pool state in that bucket. An empty bucket has zero recorded rows and blank state fields; it does not prove zero chain activity.
- Coverage metadata is from the companion graduates CSV. Field definitions are in the sample README.
Source JSONL SHA-256:
9513e2258b8f9b4f8891fbe6f02612ad9cec9a406e9e4268bf240d1d7feeec77
Mint:
Ff41mqYhF7CqcVBCkFifKUnzavpf9qxByHtrcgbFpump
A focused report for US$99.
One agreed question, clear charts, supporting data and a method you can check. Send the question first; we confirm coverage and scope before payment.